For most of the last century the phrase "once in a lifetime" was treated as a planning comfort. It is not. A flood described as "100-year" is simply the event with a 1% probability of being equalled or exceeded in any single year, the U.S. National Weather Service and FEMA explain; it is also called the "base flood" and defines the Special Flood Hazard Area used for insurance and building rules. The label is a probability, not a calendar promise. Because each year is an independent 1% draw, the chance of at least one such flood during a 30-year mortgage is about 26% (1 − 0.99³⁰). That is why homeowners well outside the shaded map still find water in the basement, and why a second "once-in-a-lifetime" event a few years later is not a statistical freak — it is basic odds.
Why a warmer atmosphere means heavier rain
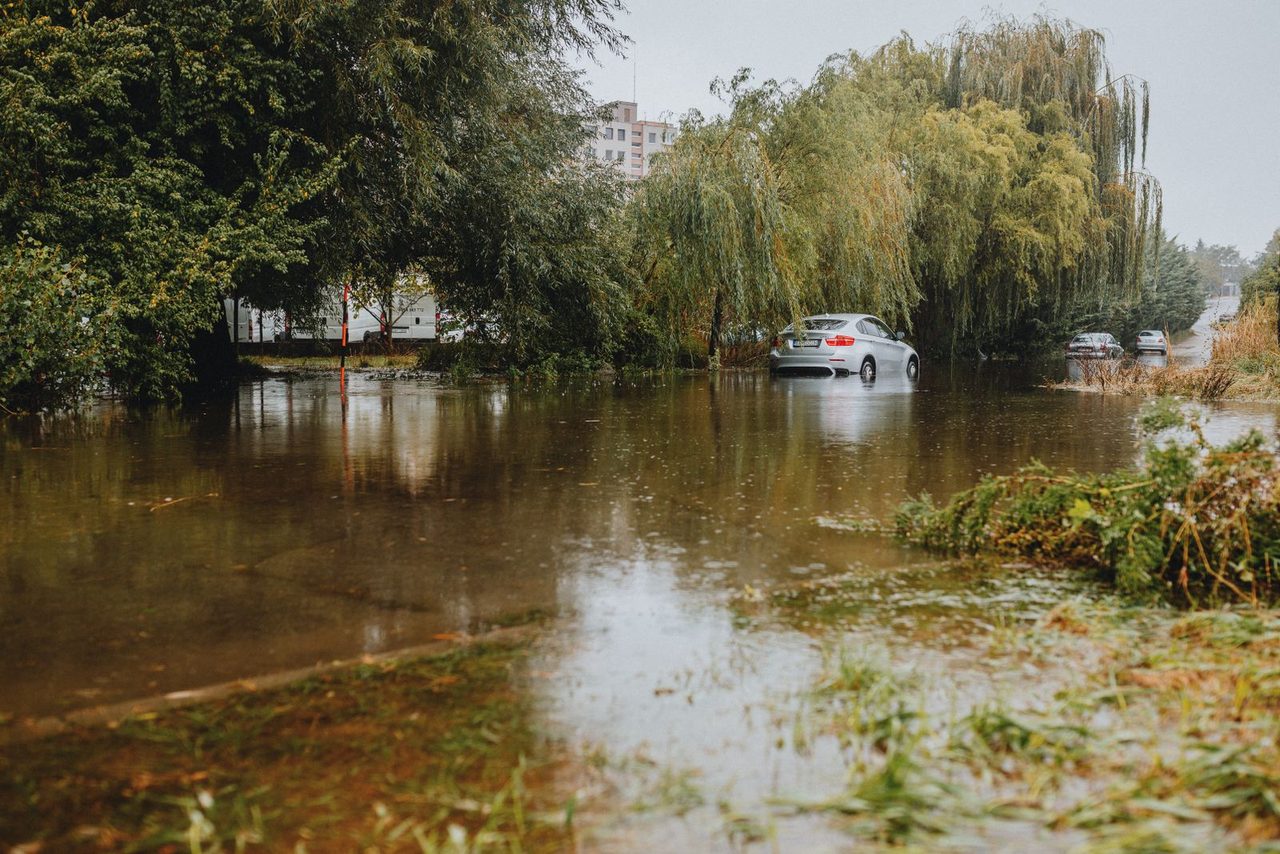
The mechanism is simple and tightly quantified. Warm air holds more water vapour, and the Clausius–Clapeyron relation puts the rate at roughly 7% more moisture per 1°C of warming. The IPCC's Sixth Assessment Report (AR6) states that, globally, the intensification of heavy precipitation follows this moisture-holding limit at "about 7% per 1°C of global warming" (high confidence), and projects a likely doubling of 10-year extreme-rain events and a tripling of 50-year events by 4°C of warming. The part that matters most for cities is in the same paragraph: the IPCC notes extreme precipitation translates directly into more pluvial floods — surface and flash floods caused when rainfall simply exceeds the capacity of streets and drains (high confidence). More water, same pipes, is a flooding recipe.
The attribution evidence: real floods, measured footprints
Attribution science now routinely puts numbers on this. In the central Mississippi Valley in early April 2025, storms that killed at least 24 people dropped the region's heaviest four-day rainfall on record; the World Weather Attribution network found human-caused warming made the downpours about 9% heavier and roughly 40% more likely, with Gulf of Mexico sea-surface temperatures made about 14 times more likely by climate change. A few weeks later, coastal New South Wales in Australia saw four-day rainfall about 10% more intense and roughly twice as likely in today's 1.3°C-warmer climate, leaving five dead and some 50,000 people isolated. During the 2025 Pakistan monsoon, the same group estimated the heavy rainfall was about 22% more intense than it would have been in a 1.3°C-cooler world. None of these studies blames climate change for every drop — but each shows the hazard itself has measurably grown.
Why drainage and outdated maps make it worse
Even with heavier rain, much of the damage is self-inflicted. Storm-sewer systems in many cities were built for a cooler, less paved past; the U.S. EPA notes existing capacity is "often not big enough" for today's volumes and, in its 2022 Clean Watershed Needs Survey, estimated about $115 billion in future stormwater investment needs. Flood maps lag too: in some areas FEMA's regulatory maps are based on analyses done 30-plus years ago, and when NOAA's newer Atlas 14 rainfall data is applied, what was mapped as a 100-year floodplain can look more like the old 500-year zone. The mismatch is large — the Association of State Floodplain Managers has estimated roughly 41 million people live in the high-risk zone versus FEMA's ~13 million inside the 1% floodplain, with average annual U.S. flood losses around $13.2 billion and projected to rise about a third by 2050.
What cities can actually do — and does it work?
The answer is not a single silver bullet but a shift from "get the water out fast" to "slow it, store it, soak it." Green infrastructure — rain gardens, bioswales, permeable pavement, urban tree canopy, restored floodplains — catches rain where it falls and eases the load on pipes. The EPA points to the Capitol Region Watershed District in Ramsey County, Minnesota, where infiltration trenches cut runoff by 77%, rain gardens by 88% and an underground storage system by 100%, at about $2 million versus a roughly $2.5 million all-pipe alternative. Pluvial floods — the kind driven by intense downpours overwhelming drains — are exactly the type green infrastructure is designed to absorb. Combined with updated maps, conservation of flood-prone land, and the early-warning systems that the 2025 events showed can reduce casualties, the package is what turns an unavoidable hazard into a manageable one.
The takeaway for homeowners and planners
Three moves matter. First, stop treating the "100-year" label as a safety guarantee — check your real exposure, including drainage and slope, not just the FEMA shading. Second, reduce runoff at the source: disconnected downspouts, rain barrels, permeable surfaces and mature trees all shrink the peak flow leaving your property. Third, support the boring but decisive public investments — map updates, storm-sewer capacity and green corridors — because individual adaptation caps out where the street still floods. Floods are becoming more frequent; the cost is not inevitable if the drainage keeps pace.

Frequently asked questions
What does "100-year flood" really mean?
It is a flood with a 1% chance of occurring in any given year, not one that happens once a century. The U.S. National Weather Service and FEMA define it as the "base flood" used to set the Special Flood Hazard Area for insurance and building rules. Because each year is an independent 1% draw, a location can see two in a decade, and over a 30-year mortgage the odds of at least one exceed 25%.
Is climate change really making rainfall heavier?
Yes, with high confidence. A warmer atmosphere holds about 7% more moisture per 1°C of warming (the Clausius–Clapeyron relation), and the IPCC's Sixth Assessment Report ties the intensification of heavy precipitation to that limit. It projects a likely doubling of 10-year extreme-rain events and tripling of 50-year events by 4°C of warming, which in turn raises pluvial (surface and flash) flood risk.
Why are floods hitting places not shown as flood zones?
Two reasons. Many flood maps understate risk — some FEMA maps still use analyses from 30-plus years ago and miss newer, heavier rainfall — and "100-year" is a probability, not a boundary line. A large share of damaging floods are pluvial: intense rain overwhelming streets and basements, which happens far outside any mapped river floodplain.
What is green infrastructure, and does it actually work?
It is a set of measures — rain gardens, bioswales, permeable pavement, urban trees, restored floodplains — that capture and soak up rain where it falls instead of funneling it into pipes. The U.S. EPA cites a Minnesota district where these cuts runoff by 77–100% at lower cost than an all-pipe rebuild, precisely because they target the type of flood caused by drains being overwhelmed.
What can a homeowner do to cut flood risk?
Check your real exposure beyond the FEMA shading, then reduce runoff at the source: disconnect downspouts into rain barrels or gardens, add permeable surfaces, and keep mature trees. That caps out where the street still floods, so also back public map updates and storm-sewer capacity — neighbourhood flooding is a shared problem, not just a private one.
This page is an informational compilation. For reference only — please refer to each source's official documentation.
Images: Pexels (free license) · Photos by contributors on Pexels.
Privacy Policy · Contact